Notes
How to calculate usable acreage after slope and setback exclusions
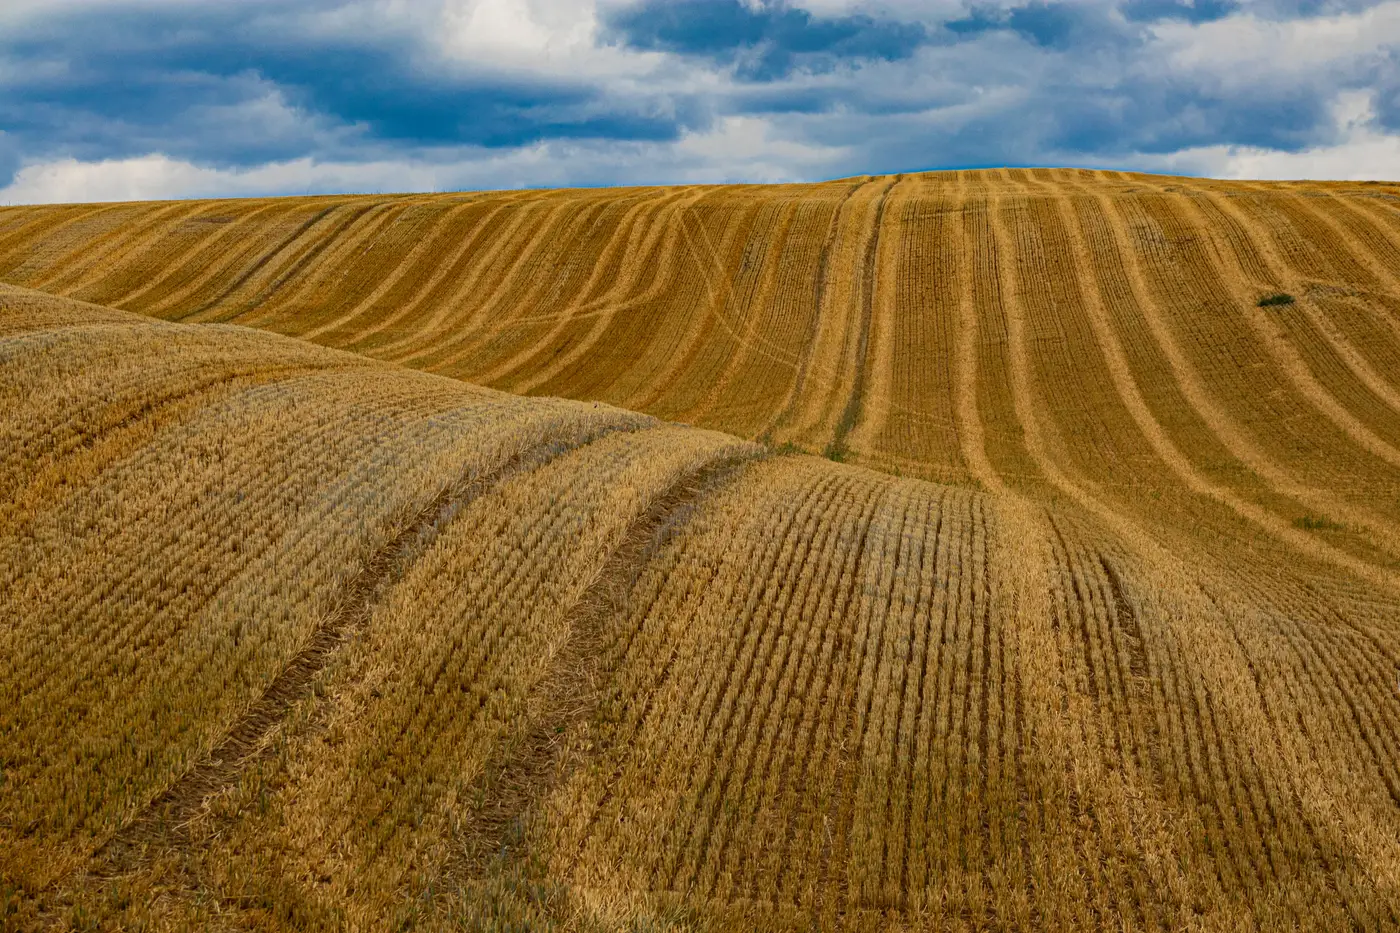
The county assessor's parcel record says 240 acres. Your spreadsheet says something much smaller once you're done subtracting what you can't build on. That gap between gross acreage and net developable acreage is where a lot of early-stage site control goes sideways, usually because someone ran the setback math before they ran the slope math, or ran both but double-counted overlap between them.
Start with gross acreage, then subtract in the right order
Gross acreage is just the deed number, the figure on the tax parcel. It tells you nothing about buildable area. To get to net buildable acreage for a solar project you're pulling out, in roughly this order:
- Property line and road right-of-way setbacks, usually set by the local zoning ordinance
- Wetland, stream, and floodplain buffers, often 50-100 ft depending on jurisdiction and water body classification
- Existing easements (transmission corridors, pipeline rights-of-way, access easements for neighboring parcels)
- Slope areas beyond what your racking can tolerate
- Any land cover you're excluding outright, like forested wetland or a remnant homestead with structures still standing
The order matters less than making sure none of these get double-subtracted. A parcel's northern edge might sit inside both a 100 ft stream buffer and a 15% slope band, and if your GIS analyst is working off two separate layers without dissolving them into one exclusion polygon, that acreage gets counted twice. Your net number comes in artificially low, and you either walk away from a parcel that actually pencils or you quote a developer a buildable area that doesn't match what shows up when the civil engineer does the real layout.
Running the slope cut
Slope exclusion is the step that trips people up most, because the tolerance isn't a fixed number across every project. Fixed-tilt racking generally wants grades under 10%, with some manufacturers allowing up to 15% on a north-south axis before structural costs climb. Single-axis trackers are pickier, typically capped lower, and east-west slope matters more than north-south for tracker rows because of self-shading and backtracking losses.
To run this yourself, you need a digital elevation model for the parcel, a slope classification run in GIS, and then a visual gut-check against aerial or satellite imagery, because DEM resolution can smooth over a gully or a berm that would otherwise eat a row of racking. A 10 m DEM is fine for a first screen across a region. It's not fine for deciding whether one specific 40-acre parcel clears the bar, where you want something closer to 0.5-2 m.
Stacking the exclusions without double-counting
Once you've got setbacks, buffers, easements, and slope all drawn as separate polygons, the clean way to combine them is a union-then-dissolve: merge every exclusion layer into one composite "unbuildable" polygon, then subtract that single polygon from the parcel boundary once. Do it layer by layer instead, subtracting setbacks, then separately subtracting slope from the original parcel, then separately subtracting buffers, and you'll overstate how much you've excluded anywhere the layers overlap, which on broken terrain is often a meaningful share of the parcel.
A rough industry habit for early screening is to expect a haircut somewhere in the 20-40% range off gross acreage, more on hilly ground with a lot of drainage, less on flat cropland with minimal easement burden. That's a sanity check for a first pass, not a number you'd put in front of a developer without running the layers.
This is exactly the manual cross-referencing step that eats a GIS analyst's week when you're screening a whole region instead of one parcel. Solar Site Screening runs the slope, aspect, size, shape, land cover, and water/flood exclusion tests across a region from satellite imagery and hands back a pass/fail parcel table, so the net acreage math is already done before anyone drives out to look.
If you're screening more than a handful of parcels at a time, it's worth seeing what that table looks like for your region.